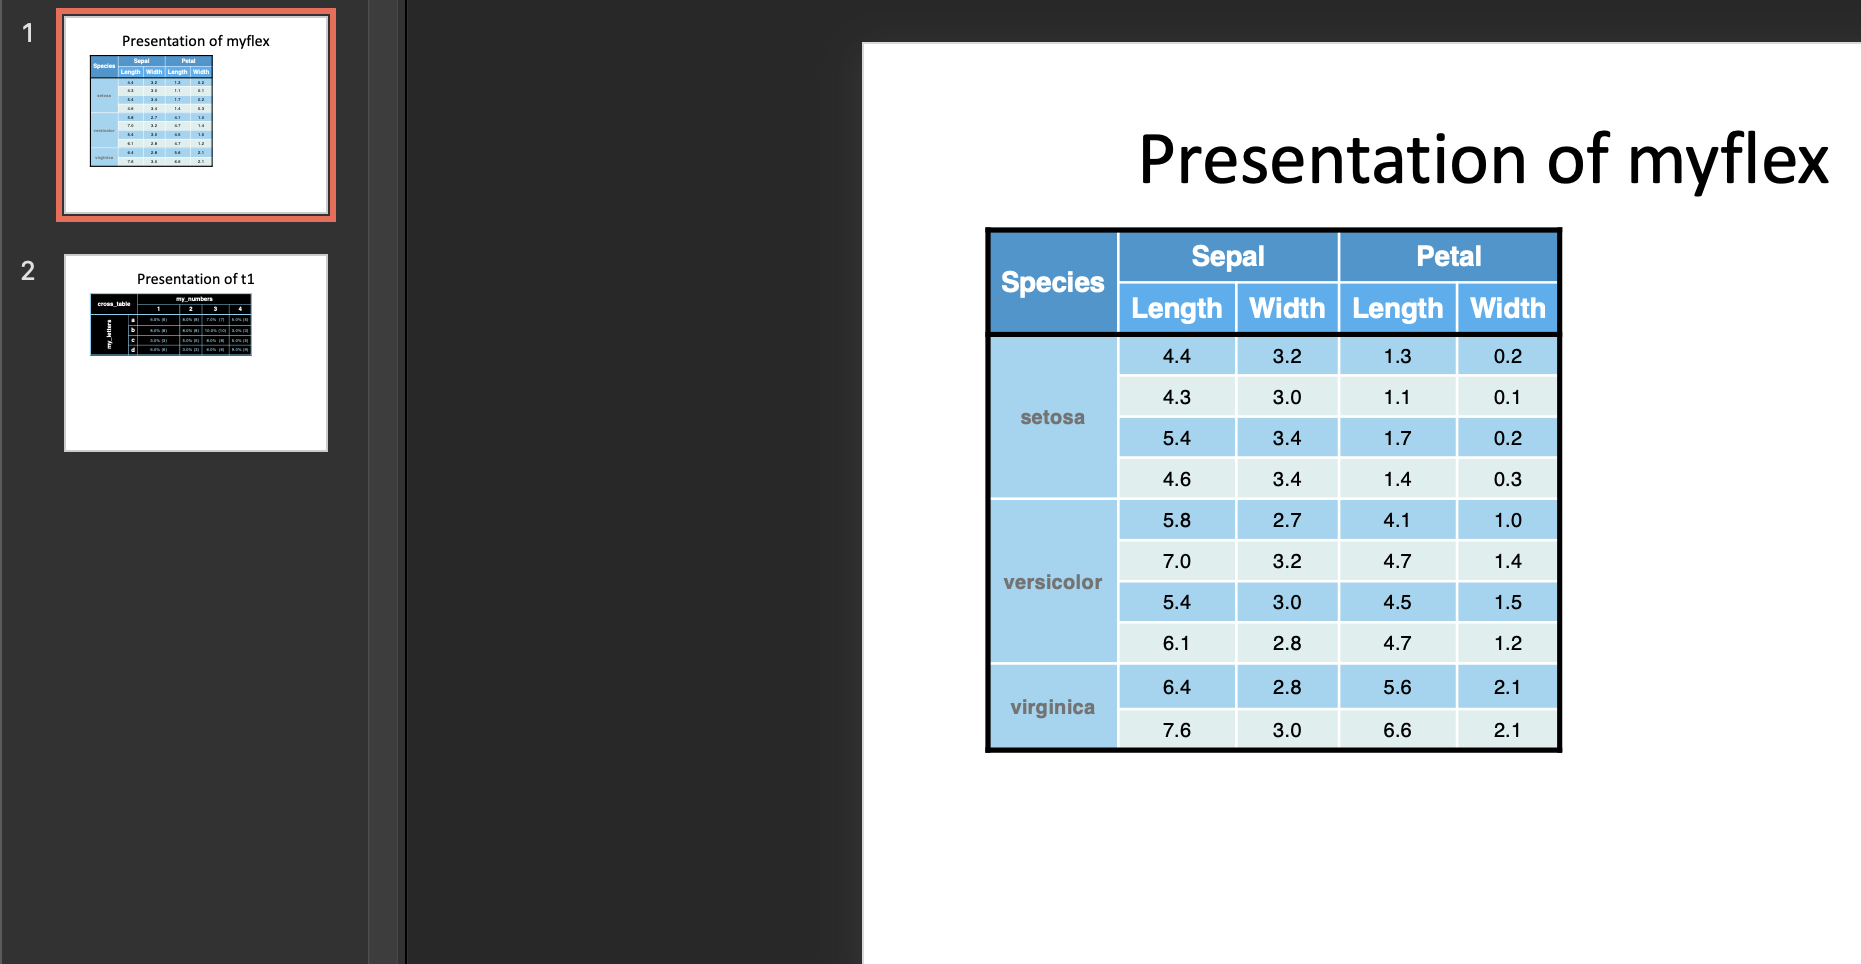
Create a flextable from a small data frame
set.seed(1)

iris %>%
  relocate("Species") %>%
  sample_n(10) %>%
  arrange(Species) -> iris_slice

header_words <- c("Sepal", "Petal")
last_id_col <- "Species"

make_flextable(iris_slice, header_words = header_words, last_id_col = last_id_col) -> myflex

myflexSpecies |
Sepal |
Petal |
||
Length |
Width |
Length |
Width |
|
setosa |
4.40 |
3.20 |
1.30 |
0.20 |
4.30 |
3.00 |
1.10 |
0.10 |
|
5.40 |
3.40 |
1.70 |
0.20 |
|
4.60 |
3.40 |
1.40 |
0.30 |
|
versicolor |
5.80 |
2.70 |
4.10 |
1.00 |
7.00 |
3.20 |
4.70 |
1.40 |
|
5.40 |
3.00 |
4.50 |
1.50 |
|
6.10 |
2.80 |
4.70 |
1.20 |
|
virginica |
6.40 |
2.80 |
5.60 |
2.10 |
7.60 |
3.00 |
6.60 |
2.10 |
|
Create a pivot table with flextable
tibble::tibble(my_letters = sample(letters[1:4], 100, T),
       my_numbers = sample(1:4, 100, T)) -> cross_table

cross_table %>%
  make_pivot_table(my_letters, my_numbers, theme = "tron") -> tron_cross_table

tron_cross_tablecross_table |
my_numbers |
|
||||
1 |
2 |
3 |
4 |
|||
my_letters |
a |
6 |
8 |
7 |
5 |
26% (26) |
b |
8 |
8 |
10 |
3 |
29% (29) |
|
c |
3 |
5 |
8 |
5 |
21% (21) |
|
d |
6 |
3 |
6 |
9 |
24% (24) |
|
|
23% (23) |
24% (24) |
31% (31) |
22% (22) |
100% (100) |
|
iris %>%
  dplyr::mutate(Species1 = stringr::str_c(Species, " very good")) %>%
  make_pivot_table(Species1, Species, show_percentages = "none", tbl_nm = "gold table", theme = "zebra_gold") -> tbl

tblgold_table |
Species |
|
|||
setosa |
versicolor |
virginica |
|||
Species1 |
setosa very good |
50 |
0 |
0 |
33% (50) |
versicolor very good |
0 |
50 |
0 |
33% (50) |
|
virginica very good |
0 |
0 |
50 |
33% (50) |
|
|
33% (50) |
33% (50) |
33% (50) |
100% (150) |
|
