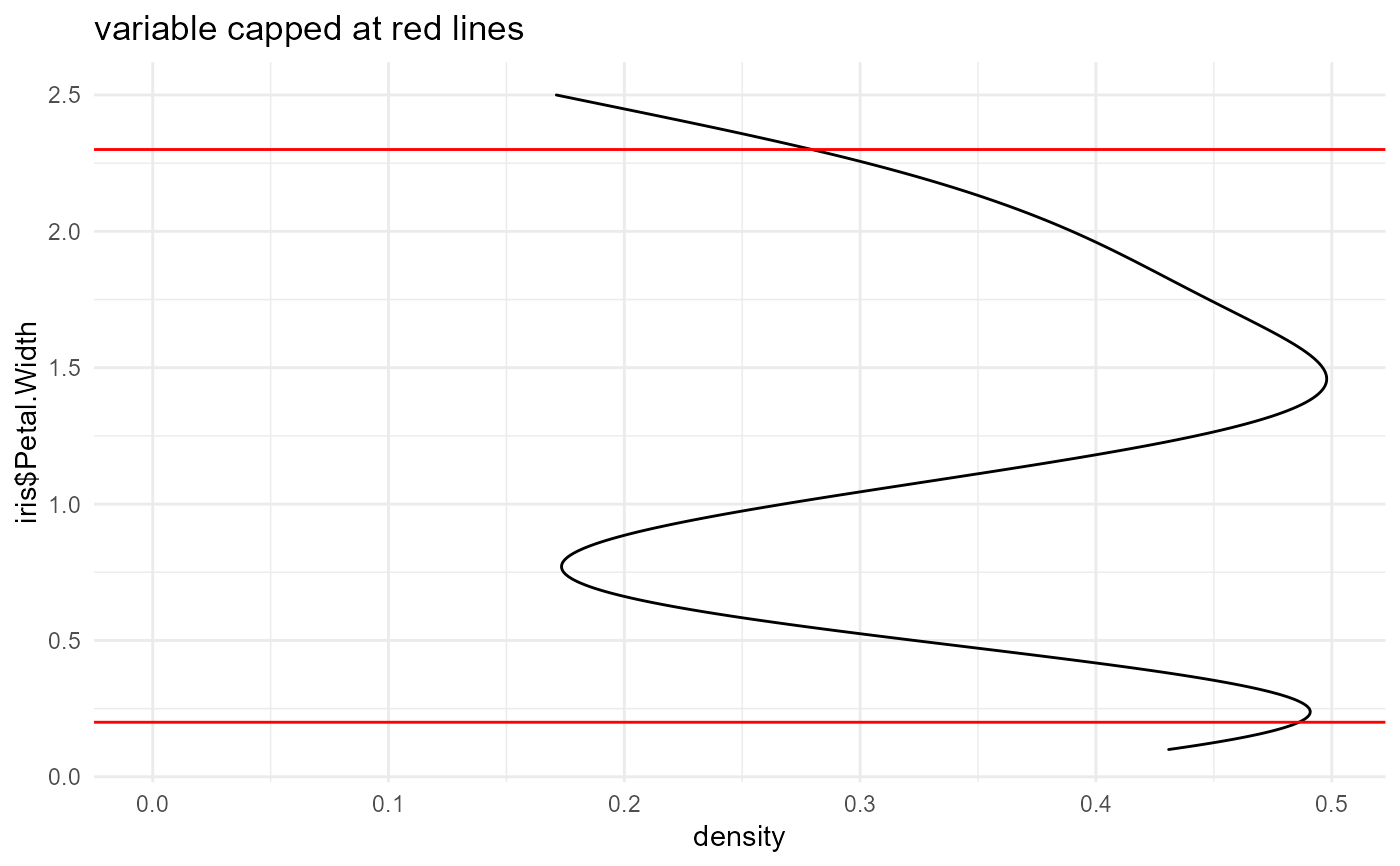
Caps the outliers of a numeric vector by percentiles. Also outputs a plot of the capped distribution
cap_outliers(x, q = 0.05, type = c("both", "upper", "lower"))Arguments
Value
numeric vector
Examples
cap_outliers(iris$Petal.Width)
#> lower cap: 0.2 upper cap: 2.3

#>   [1] 0.2 0.2 0.2 0.2 0.2 0.4 0.3 0.2 0.2 0.2 0.2 0.2 0.2 0.2 0.2 0.4 0.4 0.3
#>  [19] 0.3 0.3 0.2 0.4 0.2 0.5 0.2 0.2 0.4 0.2 0.2 0.2 0.2 0.4 0.2 0.2 0.2 0.2
#>  [37] 0.2 0.2 0.2 0.2 0.3 0.3 0.2 0.6 0.4 0.3 0.2 0.2 0.2 0.2 1.4 1.5 1.5 1.3
#>  [55] 1.5 1.3 1.6 1.0 1.3 1.4 1.0 1.5 1.0 1.4 1.3 1.4 1.5 1.0 1.5 1.1 1.8 1.3
#>  [73] 1.5 1.2 1.3 1.4 1.4 1.7 1.5 1.0 1.1 1.0 1.2 1.6 1.5 1.6 1.5 1.3 1.3 1.3
#>  [91] 1.2 1.4 1.2 1.0 1.3 1.2 1.3 1.3 1.1 1.3 2.3 1.9 2.1 1.8 2.2 2.1 1.7 1.8
#> [109] 1.8 2.3 2.0 1.9 2.1 2.0 2.3 2.3 1.8 2.2 2.3 1.5 2.3 2.0 2.0 1.8 2.1 1.8
#> [127] 1.8 1.8 2.1 1.6 1.9 2.0 2.2 1.5 1.4 2.3 2.3 1.8 1.8 2.1 2.3 2.3 1.9 2.3
#> [145] 2.3 2.3 1.9 2.0 2.3 1.8
#> [1] 0.2 0.2 0.2 0.2 0.2 0.4 0.3 0.2 0.2 0.2 0.2 0.2 0.2 0.2 0.2 0.4 0.4 0.3
#> [19] 0.3 0.3 0.2 0.4 0.2 0.5 0.2 0.2 0.4 0.2 0.2 0.2 0.2 0.4 0.2 0.2 0.2 0.2
#> [37] 0.2 0.2 0.2 0.2 0.3 0.3 0.2 0.6 0.4 0.3 0.2 0.2 0.2 0.2 1.4 1.5 1.5 1.3
#> [55] 1.5 1.3 1.6 1.0 1.3 1.4 1.0 1.5 1.0 1.4 1.3 1.4 1.5 1.0 1.5 1.1 1.8 1.3
#> [73] 1.5 1.2 1.3 1.4 1.4 1.7 1.5 1.0 1.1 1.0 1.2 1.6 1.5 1.6 1.5 1.3 1.3 1.3
#> [91] 1.2 1.4 1.2 1.0 1.3 1.2 1.3 1.3 1.1 1.3 2.3 1.9 2.1 1.8 2.2 2.1 1.7 1.8
#> [109] 1.8 2.3 2.0 1.9 2.1 2.0 2.3 2.3 1.8 2.2 2.3 1.5 2.3 2.0 2.0 1.8 2.1 1.8
#> [127] 1.8 1.8 2.1 1.6 1.9 2.0 2.2 1.5 1.4 2.3 2.3 1.8 1.8 2.1 2.3 2.3 1.9 2.3
#> [145] 2.3 2.3 1.9 2.0 2.3 1.8